This information is coming off the heels of a recent presentation I made at the American Association of Private Lenders conference at the Kansas City Convention Center. Many of the attendees were from Kansas City, Missouri. And appreciated the insights revealed in the real estate market technical analysis data (Lesson 1 of 7) from my book. Candidly, Kansas City isn’t a market that I would typically run an analysis on.
However, because a few of the locals were interested to learn more about Kansas City’s current wealth phase – from a technical analysis perspective – I decided to offer them a follow-up commentary here. Considering the kind hospitality they extended.
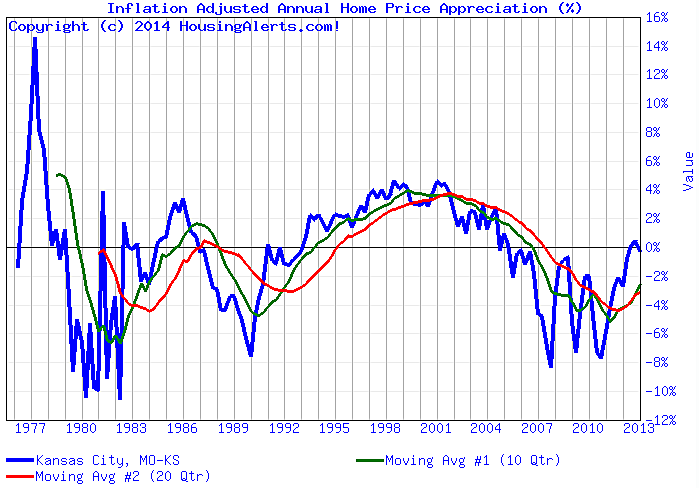
Is Kansas City, Missouri a poker hand worth playing? From a residential real estate perspective, here’s what our current Housing Alerts data reveals. As you can see, Kansas City could well be defined as a long-term secular downtrend market. At best it’s an equilibrium market.
Therefore, if you recall from the first three lessons of How to Navigate Modern Day Real Estate in 7 Simple Steps, then you would be wise to properly analyze the use of debt financing to purchase residential property in Kansas City. To be blunt, buying property to capture equity through appreciation would be careless – because the appreciation will barely exist. That doesn’t imply that you couldn’t maximize your wealth from fix-n-flip (or other) real estate strategies.
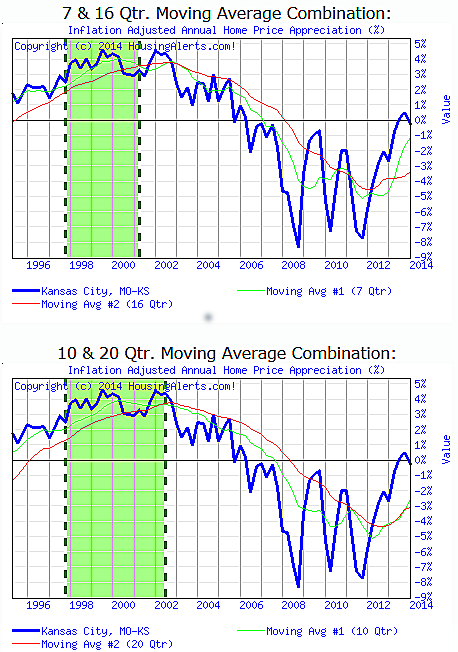
Rather, if you’re a retail consumer – or advising retail consumers – then explaining the importance of positive leverage (as it relates to cash flow) is paramount. Clearly, the Kansas City residential real estate market is not a royal flush. With that said, where does its wealth phase potential lie? Here is a current wealth phase analysis for Kansas City…
If you recall, technical analysis measures market psychology and buyer behavior. Meanwhile, we are more concerned with the long-term (red line) trend line. And the green dashed areas represent when a local market is in its wealth phase. Currently, Kansas City technical analysis data reveals that Kansas City has not yet entered its next wealth phase. As you can see, the prior wealth phase started in 1997 and ended in 2002. In other words, when Kansas City enters its next wealth phase – from a technical analysis perspective – the Housing Alerts tool will notify us with the start of another dashed green line. That wealth trigger event has not yet started.
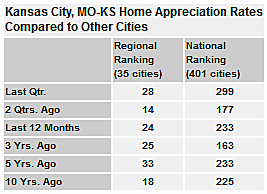
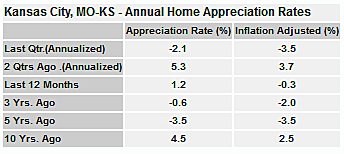
Let’s attempt to look at another player’s hand for a moment. In other words, let’s compare the current Kansas City home appreciation rates to other regional and national cities.
If we continue with our poker analogy, then it’s becoming more apparent that, not only is Kansas City not a royal flush, but it’s likely not even a three-of-a-kind. Obviously, this data could look quite different one year from now. That is yet another reason why it’s vital to use the right team and tools before you place your hard-earned money in harm’s way.
Meanwhile, you should use additional information to better optimize your buying and selling strategy. In short, this data is not intended to be legal or investing advice.
In summary, if you’ve been playing the Kansas City hand, then according to this technical analysis data, you would have been betting with a hand that ranks between weak and neutral. The good news for now is that the long-term momentum for Kansas City is heading in the right direction. But don’t tie up all your money and time with low ranking hands; only to later find that you can’t go all-in when you’re dealt a royal flush. Meanwhile, discover how to beat the odds in real estate with these seven lessons — real estate consultant.


